
Content marketing
Social
Content

1. Introduction
Email marketing succeeds when it follows a well-planned strategic programme. This must be defined by goals and objectives that can be measured to determine whether those goals have been achieved.
With this guide, marketers can learn how to use metrics and other measures to determine how effectively they are meeting their goals.
Reporting on campaign and programme performance is an essential marketing activity. Hence, this guide also presents updated information and advice for effective reporting. Topics include the benefits of effective reporting and ways to streamline the reporting challenge.
1.1 Executive summary
- Key performance indicators (KPIs) are measures marketers can use to determine whether they have achieved an objective. Email marketing KPIs use four categories of metrics: activity metrics (also known as engagement metrics), objective metrics, business metrics and inbox performance metrics. Website traffic following email campaign deliveries, mailing list growth and brand awareness can also factor into KPI reporting.
. - Accurate measurement of campaign performance must use metrics that reflect the campaign’s objectives. Marketers can call on many sets of metrics, but not all are useful or appropriate for every situation.
. - Marketers lacking a strategic objective will be unable to correctly measure performance and thus redirect focus on other activities that may eventually build revenue, such as investing in technology solutions. Technology solutions, while useful, will do little to improve performance unless they are deployed as part of the marketing strategy.
. - Triggered email programmes must align with different stages in the customer journey, from acquisition to loyalty and retention. Understanding the different stages in the customer lifecycle and the emails that can be deployed within them will help marketers create useful communications that move customers through the lifecycle.
. - Email campaigns can continue to promote the brand and its products long after deployment due to a benefit called the ‘nudge effect’.
. - Effective campaign reporting will help email marketers find and analyse the correct metrics for measuring email success. In addition, it can also help marketers provide the context that gives meaning to the numbers.
. - Good reporting helps marketers track trends, generate insights, budget and plan more efficiently, support more useful testing, help marketers inform leadership about email’s role, goals and successes, and show email’s value throughout the organisation.
1.2 Methodology
The methodology involved two main phases:
- Phase 1: Desk research to identify relevant issues, examples and models.
- Phase 2: A series of in-depth interviews with a range of email marketing experts.
Econsultancy would like to thank the following interviewees who contributed to this report:
- Tony Allen, Global CRM Lead, Volvo Cars
- Jess Evans-Tudor, Head of CRM, Rated People
- Kelly Haggard, VP – Marketing Innovation, Synchrony
- Jakob Holm, Director, Email Marketing, Pandora
- Mar Juárez, CRM Manager, IVI RMA Global
- Beata Linz, Global CRM Director, AdBirds
- Lisa Pettit, CRM Lead Developer, Specsavers
- George Williams, CRM Manager, FARFETCH Platform Solutions
1.3 About the author
 Kath lives and breathes email marketing and is recognised as one of the industry’s leading email marketers. As CEO of boutique consultancy Holistic Email Marketing, she devotes her time to developing customer-centric ecommerce journeys using a holistic, multi-channel approach.
Winner of the 2021 ANA/EEC Email Marketers Thought Leader of the Year, Kath is an industry veteran of 23 years. She is the author of the best-selling and award-winning book Holistic Email Marketing, and is a sought-after international keynote speaker, blogger, expert contributor and trainer.
linkedin.com/in/kathpay
kath@holisticemail.com
@kathpay
2. Goal Setting
2.1 The role of goals, objectives, KPIs and metrics
As with any business operation, email marketing succeeds when it follows a well-planned strategic programme, complete with marketing goals and marketing objectives, which can be measured to determine how well those marketing goals have been achieved.
- A marketing goal defines what the business wants to achieve and is very high-level. An example would be to increase revenue by 20% over a 12-month period.
. - A marketing objective is more specific and relates to how the marketer plans to achieve the marketing goal. The marketer will enlist multiple objectives to achieve the overarching goal. An example of an objective that supports the goal mentioned above would be to grow the permission-based database by 30%. The marketing team would have other marketing objectives working alongside this to achieve the goal.
. - Key performance indicators (KPIs) are tied to an organisation’s business goals and the marketing objectives and strategies chosen to achieve them.
. - Metrics are sets of data representing a specific activity, such as conversions generated by a single email campaign. A marketer can use specific metrics to measure whether a KPI has been achieved. A KPI can rely on a single metric or on a combination of metrics to indicate whether the goal was achieved.
KPIs and metrics are often confused. To illustrate the difference, take the previous example:
1. A marketing team’s goal is to increase revenue from email by 20%.
2. One of the objectives it calls on to achieve this goal is to increase the permission database by 30%.
3. The KPI it chooses to measure to determine whether this goal is achieved is reducing subscriber turnover by 50%.
4. One of the contributing metrics it uses to measure that KPI is unsubscribe rate. Another metric could be retention rate (the percentage of subscribers who opt to change their preferences instead of unsubscribing).
Email marketers can call on many sets of metrics to measure performance, but not all of them are equally useful or appropriate. Section 3 of this guide explains each set of metrics and how marketers can use them in campaign-level performance assessments and insight gathering.
2.2 Aligning strategic and tactical objectives
Email marketing has wider applications within an organisation.
Email marketing, no matter how successful, should be aligned with high-level strategic marketing and business goals. Sending emails at random times does not tend to lead to a successful email marketing programme. Similarly, programmes should not lurch from one promotional campaign to another with no plan. An approach like this will waste effort and money and likely not support overall marketing objectives.
As a first step, strategic objectives should be clearly defined. Based on these objectives, appropriate tactics can be designed.
The lack of a strategic objective can create an inability to measure performance and thus redirect focus to other activities, such as investing in technology solutions. Technology solutions, while useful, will do little to improve performance unless they are deployed as part of the marketing strategy.
For most organisations, the marketing department is usually given an annual revenue goal to hit. Marketers will often have team-level and individual objectives in service of the overall company goals. Strategic planning will help marketers choose the appropriate tactics for achieving these objectives, which in turn support the business goals.
Revenue is not always the primary goal for a campaign. When brand awareness or customer retention is the goal, a classic email format designed to convert prospects into leads will be less effective. For that reason, it is essential that emails align with campaign objectives. This effort must follow on down to the choice of metrics used to measure how close the campaign came to achieving its objectives.
A strategic approach to email marketing will involve breaking email lists into segments that can be prioritised based on their value and relative position in a marketing lifecycle. Segmentation is covered in further detail in the Segmentation and Personalisation guide that is part of Econsultancy’s Email Marketing Best Practice bundle.
Across various segments and campaigns, marketers can utilise metrics such as open reach and click reach, though other value-based metrics include:
- Revenue/profit per email or thousand emails
- Purchase frequency
- Average order value (AOV)
- Changes in the range of products purchased
- Increases in CLV
Applying the learning: Aligning strategy and tactics with goals, objectives, KPIs and metrics
To illustrate this alignment, take the example of a marketing team that wants to reduce the unsubscribe rate as a strategy to increase email activity, improve list quality and eventually achieve more sales. Making unsubscribing more difficult is not a feasible strategy for achieving that goal, as it usually increases spam complaints and inactivity.
Alternatively, the team may define, and carry out, the following:
- Overarching goal: To increase revenue from email marketing by 10% over a 12-month period.
- Objective: Reduce audience churn to improve list quality and increase conversions.
- Strategy: Give subscribers options to customise their emails.
- Tactic: Create an easy-to-use preference centre with options for changing frequency, updating an email address, opting into other email streams, etc.
- KPI: Reduce unsubscribes by 10%.
- Metric: Measure unsubscribe rate over six months.
3. Measuring Email Performance
Now that the roles and values of goals, objectives, KPIs and metrics have been established, this section will present the criteria an organisation should consider when selecting appropriate metrics and KPIs.
When selecting KPIs and metrics, it is important to ensure that the campaign KPIs being tracked map to the campaign objectives. For example, if a campaign is simply intended to raise awareness with no action requested, then open rate might be a satisfactory metric for monitoring performance, flawed though it is. (See Section 3.4.2 for a detailed discussion on using the open rate as a metric.)
For a new product announcement with a call to action that asks readers to click to a landing page and purchase a product, the KPI should reflect conversions such as sales or total revenue.
Section 3.1 details how different KPIs can be used to track email marketing campaign performance.
3.1 Email marketing KPIs and metrics
KPIs can be measured by metrics that can be grouped into four categories: activity metrics (also known as engagement metrics), objective metrics, business metrics and inbox performance metrics.
3.1.1 Email activity metrics
These are the metrics marketers most often report on. They are easy to obtain, usually in reports sent during and after the campaign. Primarily used as indicators, they might not (and often do not) reflect campaign objectives, which might call on metrics not available through basic reports from an email platform. They also do not deliver useful insights into campaign performance, customer preferences and other data beyond the open and click. Some email activity metrics are as follows:
- Email clickthrough rate (CTR): This is obtained by dividing the number of unique clicks (one click per email address) on links within the email by the number of emails delivered, before multiplying by 100 to get a percentage. What is considered high depends on several variables, including sector, quality of targeting, quality of copy, quality of calls to action, etc. Marketers should measure CTR over time to isolate, evaluate and optimise the impact of these different levers.
. - Unique open rate: This is the number of unique opens of an email (one open per email address) divided by number of emails delivered, and multiplied by 100 to get a percentage. This KPI can be useful for measuring the quality of targeting and subject lines. It does not offer any indication of the quality of the email content or call to action. This is where metrics like CTR are useful.
. - Click-to-open rate (CTOR): The click-to-open rate measures unique clicks as a percentage of the number of unique opens, and as such can be more useful than a standard clickthrough rate or open rate in measuring the effectiveness of email content. In effect, this means marketers can judge how many recipients who read an email were interested enough to click through and complete an action. To measure, divide unique clicks by unique opens and multiply by 100.
. - Response rate: Response rate refers to the number of actions resulting from the email campaign, expressed as a percentage of the overall total email volume sent and irrespective of take-up.
. - Unsubscribe (opt out) rate: An ‘unsubscribe’ describes both a subscriber’s request to be removed from an email list as well as the act of removal. The rate at which people opt out of a mailing list is affected by the quantity, quality and relevance of the emails received, so it is important to track this metric over time. A sudden spike in unsubscribes might indicate that a marketing message was not well received.
.
Some turnover in an email list is natural. What counts as a ‘good’ unsubscribe rate can vary by industry, but overall, an unsubscribe rate of 0.5% or below is considered normal, while anything under 0.2% is good.
- Unsubscribe rate of opens: Another useful metric to measure can be unsubscribe rate of opens, which measures the volume of list unsubscribes as a percentage of registered email opens. Therefore, it indicates the rate of turnover from recipients who have opened an email.
. - Spam complaint rate: This describes the percentage of recipients who mark messages as spam or junk. This might be because they are confused about who the sender is and why they are receiving the emails, or perhaps because they are unable to find the unsubscribe link, or simply because they find the emails to be spammy.
.
If brand emails receive an excessive number of spam complaints, future emails from the company – even to those who want to receive them – may be blocked or flagged by internet service providers (ISPs).
.
According to email marketing tool provider ActiveCampaign, the industry standard acceptable rate for spam complaints is less than 0.1%,[1] or one complaint for every 1,000 emails sent. Senders who generate higher rates will likely have a harder time reaching their subscribers’ inboxes.
3.1.2 Objective metrics
These objective-based metrics reflect campaign objectives for campaigns that aim to achieve more than awareness. They reflect subscriber activity but go beyond the inbox level to measure whether the campaign achieved its objective.
- Conversions: While the term ‘conversions’ tends to relate to completed sales in ecommerce, in email marketing a conversion can refer to any completed action triggered by an email. Examples include subscribing to a newsletter, downloading a mobile application, downloading a whitepaper or completing a survey. The conversion rate is therefore simply the percentage of email recipients who completed a desired action triggered by an email.
. - Return on investment (ROI): This is the ultimate metric of marketing performance. However, it is not the only indicator of success. ROI can be generated at campaign level or over a period to determine a more general ROI figure. Email service providers may offer tools that can provide their own analysis of email ROI.
.
In broad terms, ROI is calculated by dividing campaign revenue by the cost of investment. This requires defining the following:.- A conversion, for the purposes of the campaign. This can be a completed transaction, or some other conversion such as completing a form to speak with a sales consultant or downloading a whitepaper.
. - The average monetary value of a conversion.
. - The revenue generated by the campaign (defined as the number of recipients who converted multiplied by the value of each conversion).
. - The investment cost of running the campaign..
- A conversion, for the purposes of the campaign. This can be a completed transaction, or some other conversion such as completing a form to speak with a sales consultant or downloading a whitepaper.
3.1.3 Business metrics
Business metrics measure the results of an ecommerce campaign and should map back to the campaign objectives. They include:
- Total campaign revenue
- Revenue per email
- New leads
- Average order size
- First-time purchases vs repeat purchases
- Customer lifetime value
Accurate measurements for these metrics usually require that the email service provider (ESP) be closely integrated with an ecommerce or customer relationship management (CRM) system. They also should be tracked not just for one campaign but over time to indicate trends. This allows marketers to optimise their campaign emails or automations to correct problem areas.
A system of integrated platforms enables an automated flow of data and allows marketers to clearly evaluate campaign performance. Many ESPs as well as other platforms optimise their reporting using data visualisation in graphs and charts rather than raw numbers.
The most important metric: lifetime value
“One of the most important [metrics] is lifetime value. All organisations should consider this and aim to keep their consumers in the long term, providing value to them along their journey.”
Beata Linz, Global CRM Director, AdBirds
3.1.4 Inbox performance metrics
Inbox performance metrics measure how well the campaign performed at an ISP (internet service provider) or mailbox provider such as Outlook, Gmail, AOL, etc. They measure whether campaigns are successfully reaching subscribers’ inboxes. (For strategies on optimising email deliverability, see Econsultancy’s report on Email Marketing Best Practice: Optimisation.)
- Deliverability (acceptance) rate: Delivery rate, or acceptance rate, refers to the percentage of emails that were successfully received by subscribers’ email servers, and did not bounce (get returned).
.
There are two main ways deliverability should be measured:.
-
- Returned email deliverability: This measures the volume of emails sent less the number of bounces (both soft and hard – see below) received.
. - Inbox placement: This measures the volume of emails delivered to an inbox, rather than to the spam folder, and does not include those emails that are undelivered.
- Returned email deliverability: This measures the volume of emails sent less the number of bounces (both soft and hard – see below) received.
- An example would be 100% sent, 1.7% bounced (hard and soft) = 98.3% delivered. If 97% of these delivered emails were placed into the inbox, and 3% were placed in the spam folder, then the inbox placement would be 97%.
. - As a metric, deliverability rate can reveal much about the quality of the data in an email address list and how those email addresses were initially acquired.
- Bounce rate: The inverse of delivery rate is bounce rate, which calculates the percentage of emails sent that were not successfully delivered. Email bounces can be split into two categories – hard and soft:
.- A hard bounce occurs when an email address is incorrect or does not exist. These addresses should be immediately removed from a list. A derivative of this metric is the average hard bounce rate, that is, the number of hard bounces divided by the number of emails delivered and multiplied by 100 to give a percentage.
. - A soft bounce indicates a temporary delivery problem, such as an inbox being full or a server being down. A derivative of this metric is the average soft bounce rate, that is, the number of soft bounces divided by the number of emails delivered and multiplied by 100 to give a percentage.
- A hard bounce occurs when an email address is incorrect or does not exist. These addresses should be immediately removed from a list. A derivative of this metric is the average hard bounce rate, that is, the number of hard bounces divided by the number of emails delivered and multiplied by 100 to give a percentage.
Individual email error codes
Simple Mail Transfer Protocol (SMTP) refers to the internet standard for email transmission. When an email is sent, it is sent via these protocols for the most successful email deliverability possible.
When emails experience a delivery issue, an SMTP error code will be returned. Each type of error has its own individual code. Marketers should always review failure messages in their delivery reports sent during and after a campaign send to understand why the error occurred.
The Internet Assigned Numbers Authority (IANA) is responsible for coordinating some of the key elements that keep the internet running smoothly. It maintains a full list of SMTP codes. Some common SMTP error codes are as follows:
- 422: The recipient’s mailbox has exceeded its storage limit.
- 450: User’s mailbox is unavailable.
- 452: Too many emails sent or too many recipients.
- 510: Bad (undeliverable) email address.
- 513: Address type is incorrect.
- 550: Non-existent email address.
- 552: Exceeded storage allocation.
IANA | The Internet Assigned Numbers Authority[2]
3.2 Metrics beyond the email campaign
Email campaigns can have ripple effects across other channels and support initiatives beyond the immediate conversion goal. The following three metrics help marketers determine whether a brand’s email campaigns are helping achieve these broader business objectives:
- Site traffic: As emails are frequently opened on mobile devices, it is possible that recipients open a message but do not visit the site until a later time, potentially on a different device. Marketers should track general increases in traffic after email distribution. While this is not a precise measure of email performance, it can indicate how well an email campaign drives traffic to a site even if a recipient does not open an individual message.
. - List growth: It is important to proactively try to grow the number of email subscribers, otherwise the list will atrophy as customers naturally move out of target segments. List growth can occur by encouraging customers to sign up at the point of an ecommerce transaction, through on-site sign-up widgets or social media campaigns, or even at offline customer contact points such as in-store kiosks or via printed collateral.
. - Brand awareness and affinity: Email campaigns as well as triggered and targeted campaigns are a useful way to maintain brand share of mind, particularly if the customer has not transacted for a while. Even customers who could be considered ‘emotionally unsubscribed’ (i.e. inactive but they have not actually clicked unsubscribe) could still either act as brand advocates or transact again in the future.
.
Customer reviews, profiles of employees, information about using the brand’s products, and other non-promotional content can also build the emotional connections that keep customers interested in the brand even if they are not actively in the market to buy.
.
While brand awareness and affinity is difficult to measure and more of a beneficial soft metric of email marketing, the importance of email to brand awareness should not be underestimated. See Section 3.8 for a discussion of email’s ‘nudge’ relationship with other marketing channels, which describes how email can be the catalyst for other activities.
3.3 A summary of email marketing metrics
Table 1: Email marketing metrics as key performance indicators
| Email activity metrics | |
| Metric | Purpose |
| Email clickthrough rate (CTR) |
|
| Unique open rate |
|
| Click-to-open rate (CTOR) |
|
| Response rate |
|
| Unsubscribe (opt out) rate |
|
| Unsubscribe rate of opens |
|
| Spam complaint rate |
|
| Objective metrics | |
| Metric | Purpose |
| Conversion rate |
|
| Return on investment (ROI) |
|
| Business metrics | |
| Metric | Purpose |
| Total campaign revenue |
|
| Revenue per email |
|
| New leads produced |
|
| Average order size |
|
| First-time vs repeat purchases |
|
| Customer lifetime value |
|
| Inbox performance metrics | |
| Metric | Purpose |
| Deliverability (acceptance) rate |
|
| Bounce rate |
|
| SMTP error codes |
|
| Metrics beyond the email campaign | |
| Metric | Purpose |
| Site traffic |
|
| List growth |
|
| Brand awareness and affinity |
|
3.4 Measuring email campaigns
Conversions are often referred to as ‘goals’ to include the breadth of different outcomes that an email campaign might be aiming to achieve. Measuring campaign goals – such as a customer downloading a whitepaper or completing a survey – requires a combination of email marketing data, web analytics and business reporting systems.
Marketers must consider specific objectives for the campaign when planning campaigns in order to evaluate success. Campaigns will have different success metrics depending on their objectives. Conversions should be defined according to these objectives.
3.4.1 Campaign-focused metrics
For campaigns that are aimed at driving engagement, conversions may be more difficult to define. Instead, marketers can start to model engagement metrics to build a picture of performance. For example, marketers can analyse:
- Emails sent
- Emails delivered
- Email opens
- Email clickthroughs
- Email responses
- Landing page conversions, e.g. registration, download, transaction, etc.
Marketers can also review metrics from integrated channels to create a more complete picture of performance. For example:
- Referral traffic
- Time on site
- Social shares and social engagement
A cloud-based, integrated marketing stack that includes an ESP, CMS and analytics platform will allow marketers to examine these metrics in a single dashboard.
3.4.2 Use caution with open rate as a success metric
Despite many warnings against basing a campaign’s success or failure on the open rate and its many variations, it remains the most popular measurement, according to a 2023 benchmark report from Mailjet by Sinch.[3]
In Mailjet’s Inbox Insights 2023 study,[4] 42.7% of email marketers said the open rate is one of their most important success metrics, which was very closely followed by 42.1% who selected clickthrough rate. In contrast, the most frequently cited business or objective-related metric was conversion rate (26%), while just 7.6% of marketers cited ROI as an important metric.
It is easy to understand why marketers might rely on some metrics more than others. Activity metrics are gathered and compiled in most ESP reports and are easily accessed, while strategic or business metrics require a close integration of all the platforms a marketer uses in an email programme and are seldom reported in a common dashboard. Further, marketers might not easily gain access to the key revenue or cross-channel engagement metrics that can shed even more light on programme performance.
The consequences of using the wrong success measurements can be significant. It can lead marketers to declare a campaign or email programme as having achieved its goal when it might actually be failing, or to undervalue a successful one.
A business case for using open rate
“We’ve moved away from open rate, but there was still a business need for us. Some of our customer reports are based on predictive open rate, which we worked on with our ESP. Depending on what the business need is, there’s a report or a resource available to get there.”
Kelly Haggard, VP, Marketing Innovation, Synchrony
Marketers using open rate as a success metric should bear the following points in mind:
- A true ‘open’ may not be registered as such: Email marketing software providers track open rates via a transparent image known as a tracking pixel. This pixel downloads when the email is opened, notifying the system that the email has been opened.
.
‘Opens’ reflect the number of times this tracking pixel has loaded. This means that even if a person opens an email and reads its text, if images are not enabled, the email will not be recorded as opened. Many email clients, including Outlook and Gmail, disable images by default, while recipients who opt for plain text emails will also not receive the tracking pixel, which can only be included in HTML emails.
- Some email clients may overcount ‘opens’, thus inflating the results: In cases where images are enabled by default, an ‘open’ will be registered each time the person clicks the email, even if it only shows up in the preview pane. Some email clients, such as Hotmail, will automatically open email as the person scrolls through their inbox.
.
Note also that auto responses, such as out of office replies, may be counted as opens by some less advanced email marketing software.
- Apple’s MPP artificially inflates open rates: Finally, the introduction of Apple’s Mail Privacy Protection (MPP) feature, which artificially inflates open rates to mask its users’ email activity, further undermines the open rate as an effective success measure, even for basic awareness campaigns.
. - The effects of MPP are still being measured. There is no single standard for the rate at which MPP distorts the actual open rate of a campaign because it depends on several factors:
- The percentage of subscribers who open and read email in Apple desktop or mobile Apple devices (including the iPhone and Apple Watch).
. - How many have updated their devices’ operating systems to iOS 15, which introduced MPP.
. - How many users have turned on the ‘Protect Mail Activity’ feature on their devices.
.
- The percentage of subscribers who open and read email in Apple desktop or mobile Apple devices (including the iPhone and Apple Watch).
- However, it is generally believed among multiple sources that track email client share of market (measured largely by open rates) that the MPP adoption level has stabilised enough for marketers to be able to gauge the impact on their engagement measures. According to email deliverability vendor Validity’s Guy Hanson: “80% of all [email] open events are MPP-generated false positives”.[5]
. - One quick way to measure MPP’s impact is to compare the open rate from before 20 September 2021, when the feature was introduced, with open rates that have been recorded since that date. If other measures, including click and unsubscribe rates (but not click-to-open), remain stable while the open rate appears to be higher, the marketer can reasonably assume that MPP is driving a large measure of that increase.
Marketers recover from MPP metrics shakeup
“When Apple’s Mail Privacy Protection [MPP] was first introduced in September 2021, it threw off our reporting like crazy. We had been trying to work out what a healthy metric would be to replace it. Now that we have annualised the data, we know it’s not super-accurate, but we can do a fair year-on-year comparison when we are looking at older metrics.
“We also had to go to generic numbers like clickthrough rate. Understanding the impacts of our subject lines for that first year was very hard. But when you use user engagement with the communications, [you can ask] ‘Are they actually clicking?’ and ‘What’s your unsubscribe rate?’
“Losing the open rate didn’t affect our automations or targeting because our segmentation at that point was more based on purchase rate and engagement, and actual clickthrough engagement.”
Jess Evans-Tudor, Head of CRM, Rated People
3.5 Using models to map campaign performance
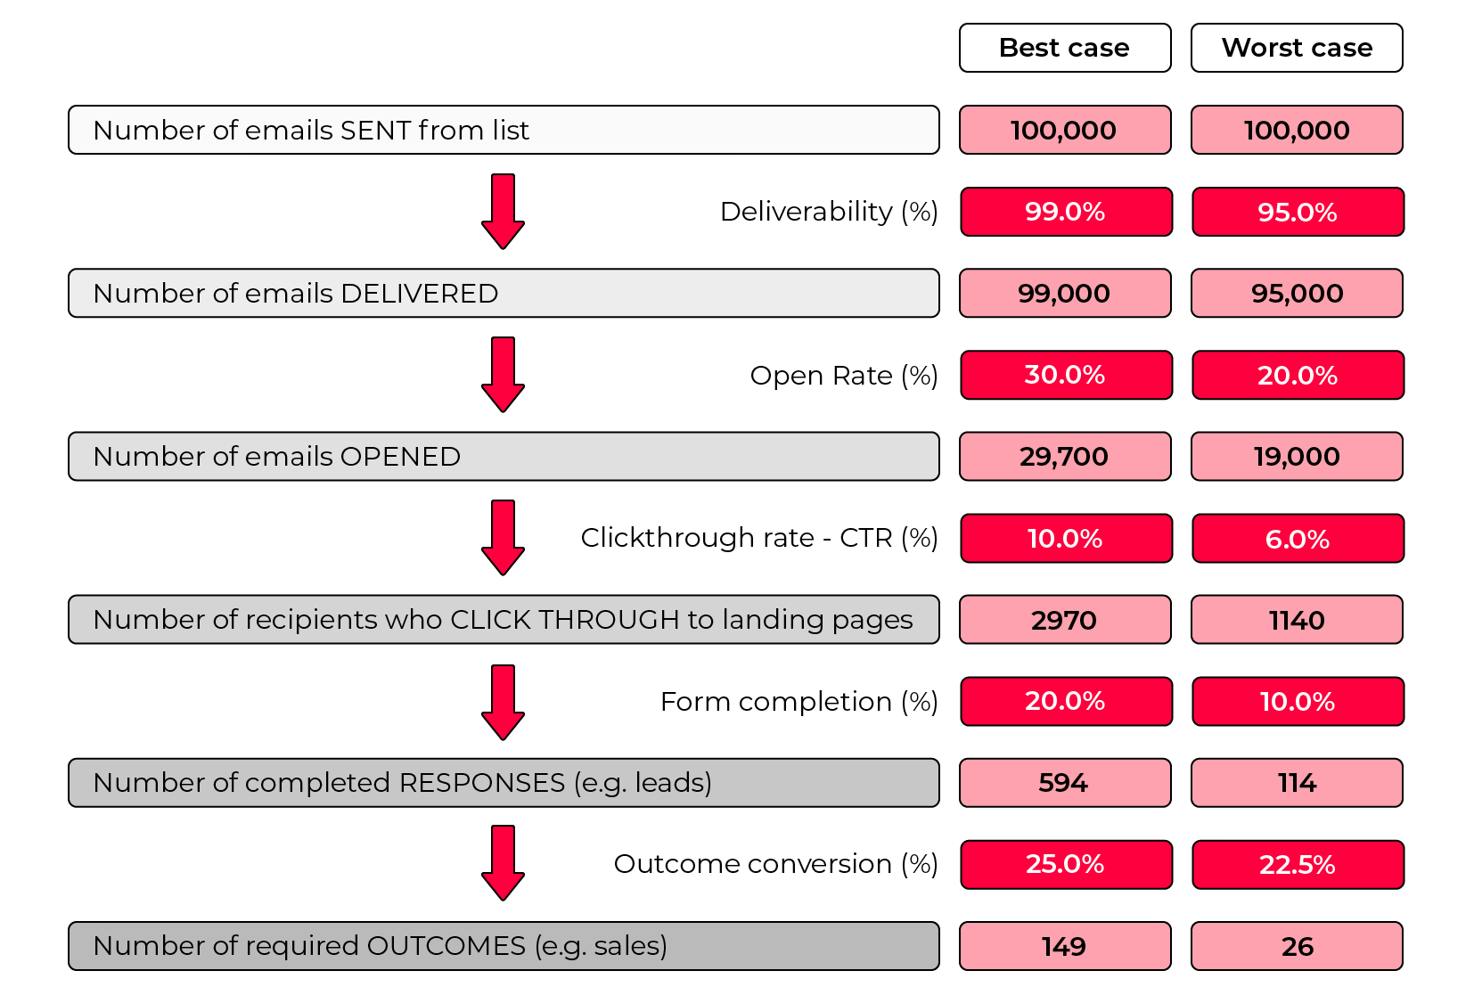
Marketers can use spreadsheets to build models of measurement and start estimating the response to a campaign. Marketers can model best- and worst-case performance scenarios (Figure 1).
A model of sales performance can be forecasted by using past performance data. The example illustrated in Figure 1 shows that with a list of 100,000, a modelled response of sales could vary between 26 and 149. The model demonstrates the value of optimising engagement metrics such as open rates, clickthroughs and landing page performance to reduce attrition and optimise sales performance.
Figure 1: Conversion model for email response showing best- and worst-case scenarios
Source: Econsultancy
3.6 Activity and engagement objectives across the customer journey
Marketers running transactional sites will have objectives relating to the customer’s place in the funnel. These stages can generally be aligned to the objectives given in Table 2.
Table 2: Funnel stages and objectives
| Stage | Stage objective |
| Acquisition |
|
| Conversion |
|
| Retention |
|
| Reactivation |
|
Accurately identifying where emails with these different stage objectives can be deployed requires a thorough understanding of the customer journey and the behavioural triggers that signal where a potential customer is on that journey. When the different stages in the customer lifecycle are understood, a communications plan to facilitate progression through the lifecycle can be mapped accordingly. For more information on mapping the stages, see Econsultancy’s Customer Journey Mapping Best Practice Guide.
For B2B organisations, it is particularly important to track the influence of email on conversion rate, as for considered purchases of high value, the final conversion will likely come from another channel. In addition, the final conversion may be completed offline.
B2B marketers must track engagement over time through a lead nurturing programme to gauge the value of email marketing. They should consider mapping out the key stages in their buying cycles before auditing their approach to email to facilitate customers’ movement through the sales cycle. For purchases that require a longer consideration cycle, marketers must focus more on engagement than the hard sell. This means creating and distributing valuable content to prospects.
Good email marketers will demonstrate their expert knowledge of the market to the customer in order to gain trust and establish credibility in the mind of the customer before they transact. This is where valuable content comes in.
Traditional sources of valuable content include company newsletters that report on industry news, developments, best practice and educational conferences. There is still a place for promotional material in the cycle, though this content should be focused on helping readers accomplish their own goals. Brands can create and publish this kind of content themselves.
Vimeo, a video hosting platform, publishes an excellent company email newsletter (see Figure 2) that skilfully combines news as well as how-tos for video creators, producers and Vimeo users. The brand’s promotional message is subtle but authoritative. There is no sales pitch, not even for its free services. Instead, Vimeo highlights its expertise through a user profile, offers how-to and problem-solving guides and produces an aspirational and inspirational video ‘magazine’.
Figure 2: Example of a B2B newsletter that provides information for users and prospects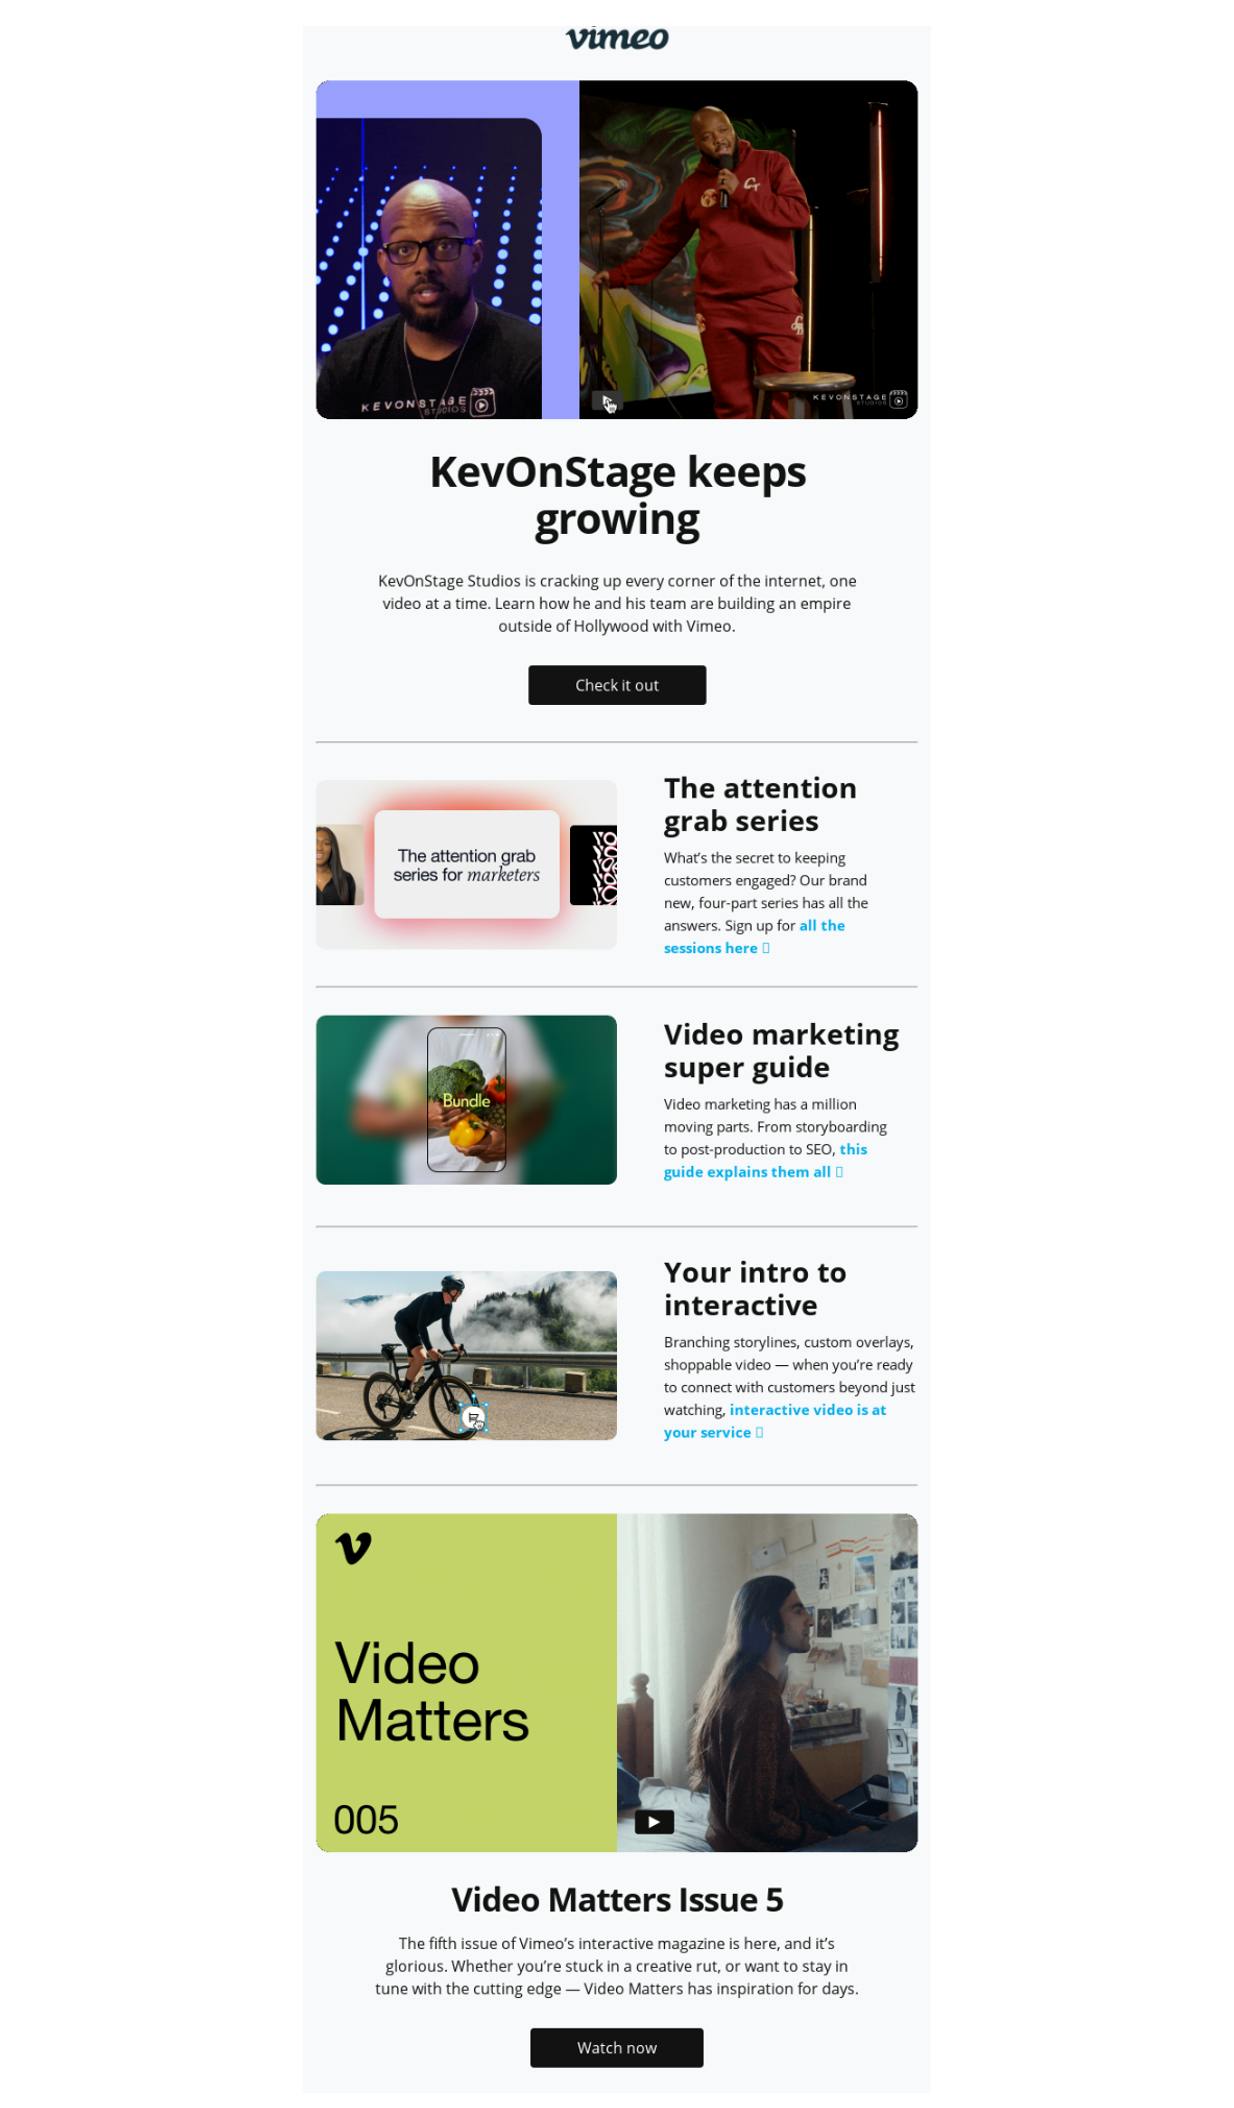
Source: Vimeo[6] via MailCharts[7]
3.7 Measuring long-term engagement by segment
The behaviour of different segments of customers should be measured separately and over time. For example, a brand could review engagement for periods of time such as 0–3 months, 3–6 months, etc., and determine minimum acceptable rates for list quality and engagement. Categories with percentages that exceed negative rates, such as ‘never opened’ or ‘never clicked’, should be addressed with strategies to build engagement. Removal from the list should be considered the last resort as the company has already invested time and, perhaps, budget in acquiring those addresses through incentives or discounts.
This analysis is useful for uncovering insights about which segments are most valuable and which segments should be prioritised. It will also reveal which accounts appear to be dormant. The DMA 2023 Consumer Email Tracker found that 10% of consumers said they had email accounts they no longer used,[8] up from 8% in the 2020 report. Therefore, it is important to use lifetime email tactics while continually focusing on email list growth to minimise the impact of these potentially dormant accounts on email opens, clicks and conversions.
Over time, the company’s ‘minimum acceptable rates’ should be used to set goals for list quality and engagement. They can be broken down by subscriber activity.
Table 3 shows an analysis of engagement for a sample consumer email list. It is not to be viewed as a benchmark of activity for all uses. Rather, it is presented here as a representation of what a company might find in its analysis.
Table 3: Analysis for longer term engagement with email marketing
| Measure | Period | Number of subscribers | Percentage of list total |
| Never opened | All time | 48,000 | 16% |
| Last 6 months | 168,000 | 56% | |
| Never clicked | All time | 96,000 | 32% |
| Last 6 months | 144,000 | 48% | |
| Never bought | All time | 48,000 | 16% |
| Last 6 months | 192,000 | 64% | |
| Never clicked | All time | 96,000 | 32% |
| Last 6 months | 216,000 | 72% |
3.8 Email’s ‘nudge’ relationship with other channels
Attribution remains a challenge for even the most advanced organisations. Part of the reason for the challenge is outdated workflows, while the tendency for marketers to focus on channels in isolation can also muddy the waters.
Organisations that struggle with attribution will find it difficult to identify underserved or overserved channels and optimal marketing tactics. Email can be under-recognised in its contribution to marketing performance, particularly if the organisation relies on an attribution model that uses the last click before the conversion to apportion responsibility for that conversion.
The 2023 Consumer Email Tracker,[9] published by the DMA, looked at the activities that email subscribers are most likely to take upon receiving an email from a brand. These highlight that while the email might kick-start the customer’s journey, the purchase might happen on another channel, and email will not receive the attribution for this conversion.
The nudge effect can be seen in other actions, such as saving the email for a later date, visiting the company’s social media channels, going directly to the company’s website rather than clicking a link to it in the email, or visiting a physical location.
As Figure 3 shows, out of the all the possible actions a consumer can take, as listed by the DMA, only two are likely to be attributed to email – click on link and reply to the sender.
Figure 3: Actions users are most likely to take with interesting emails (pre-purchase)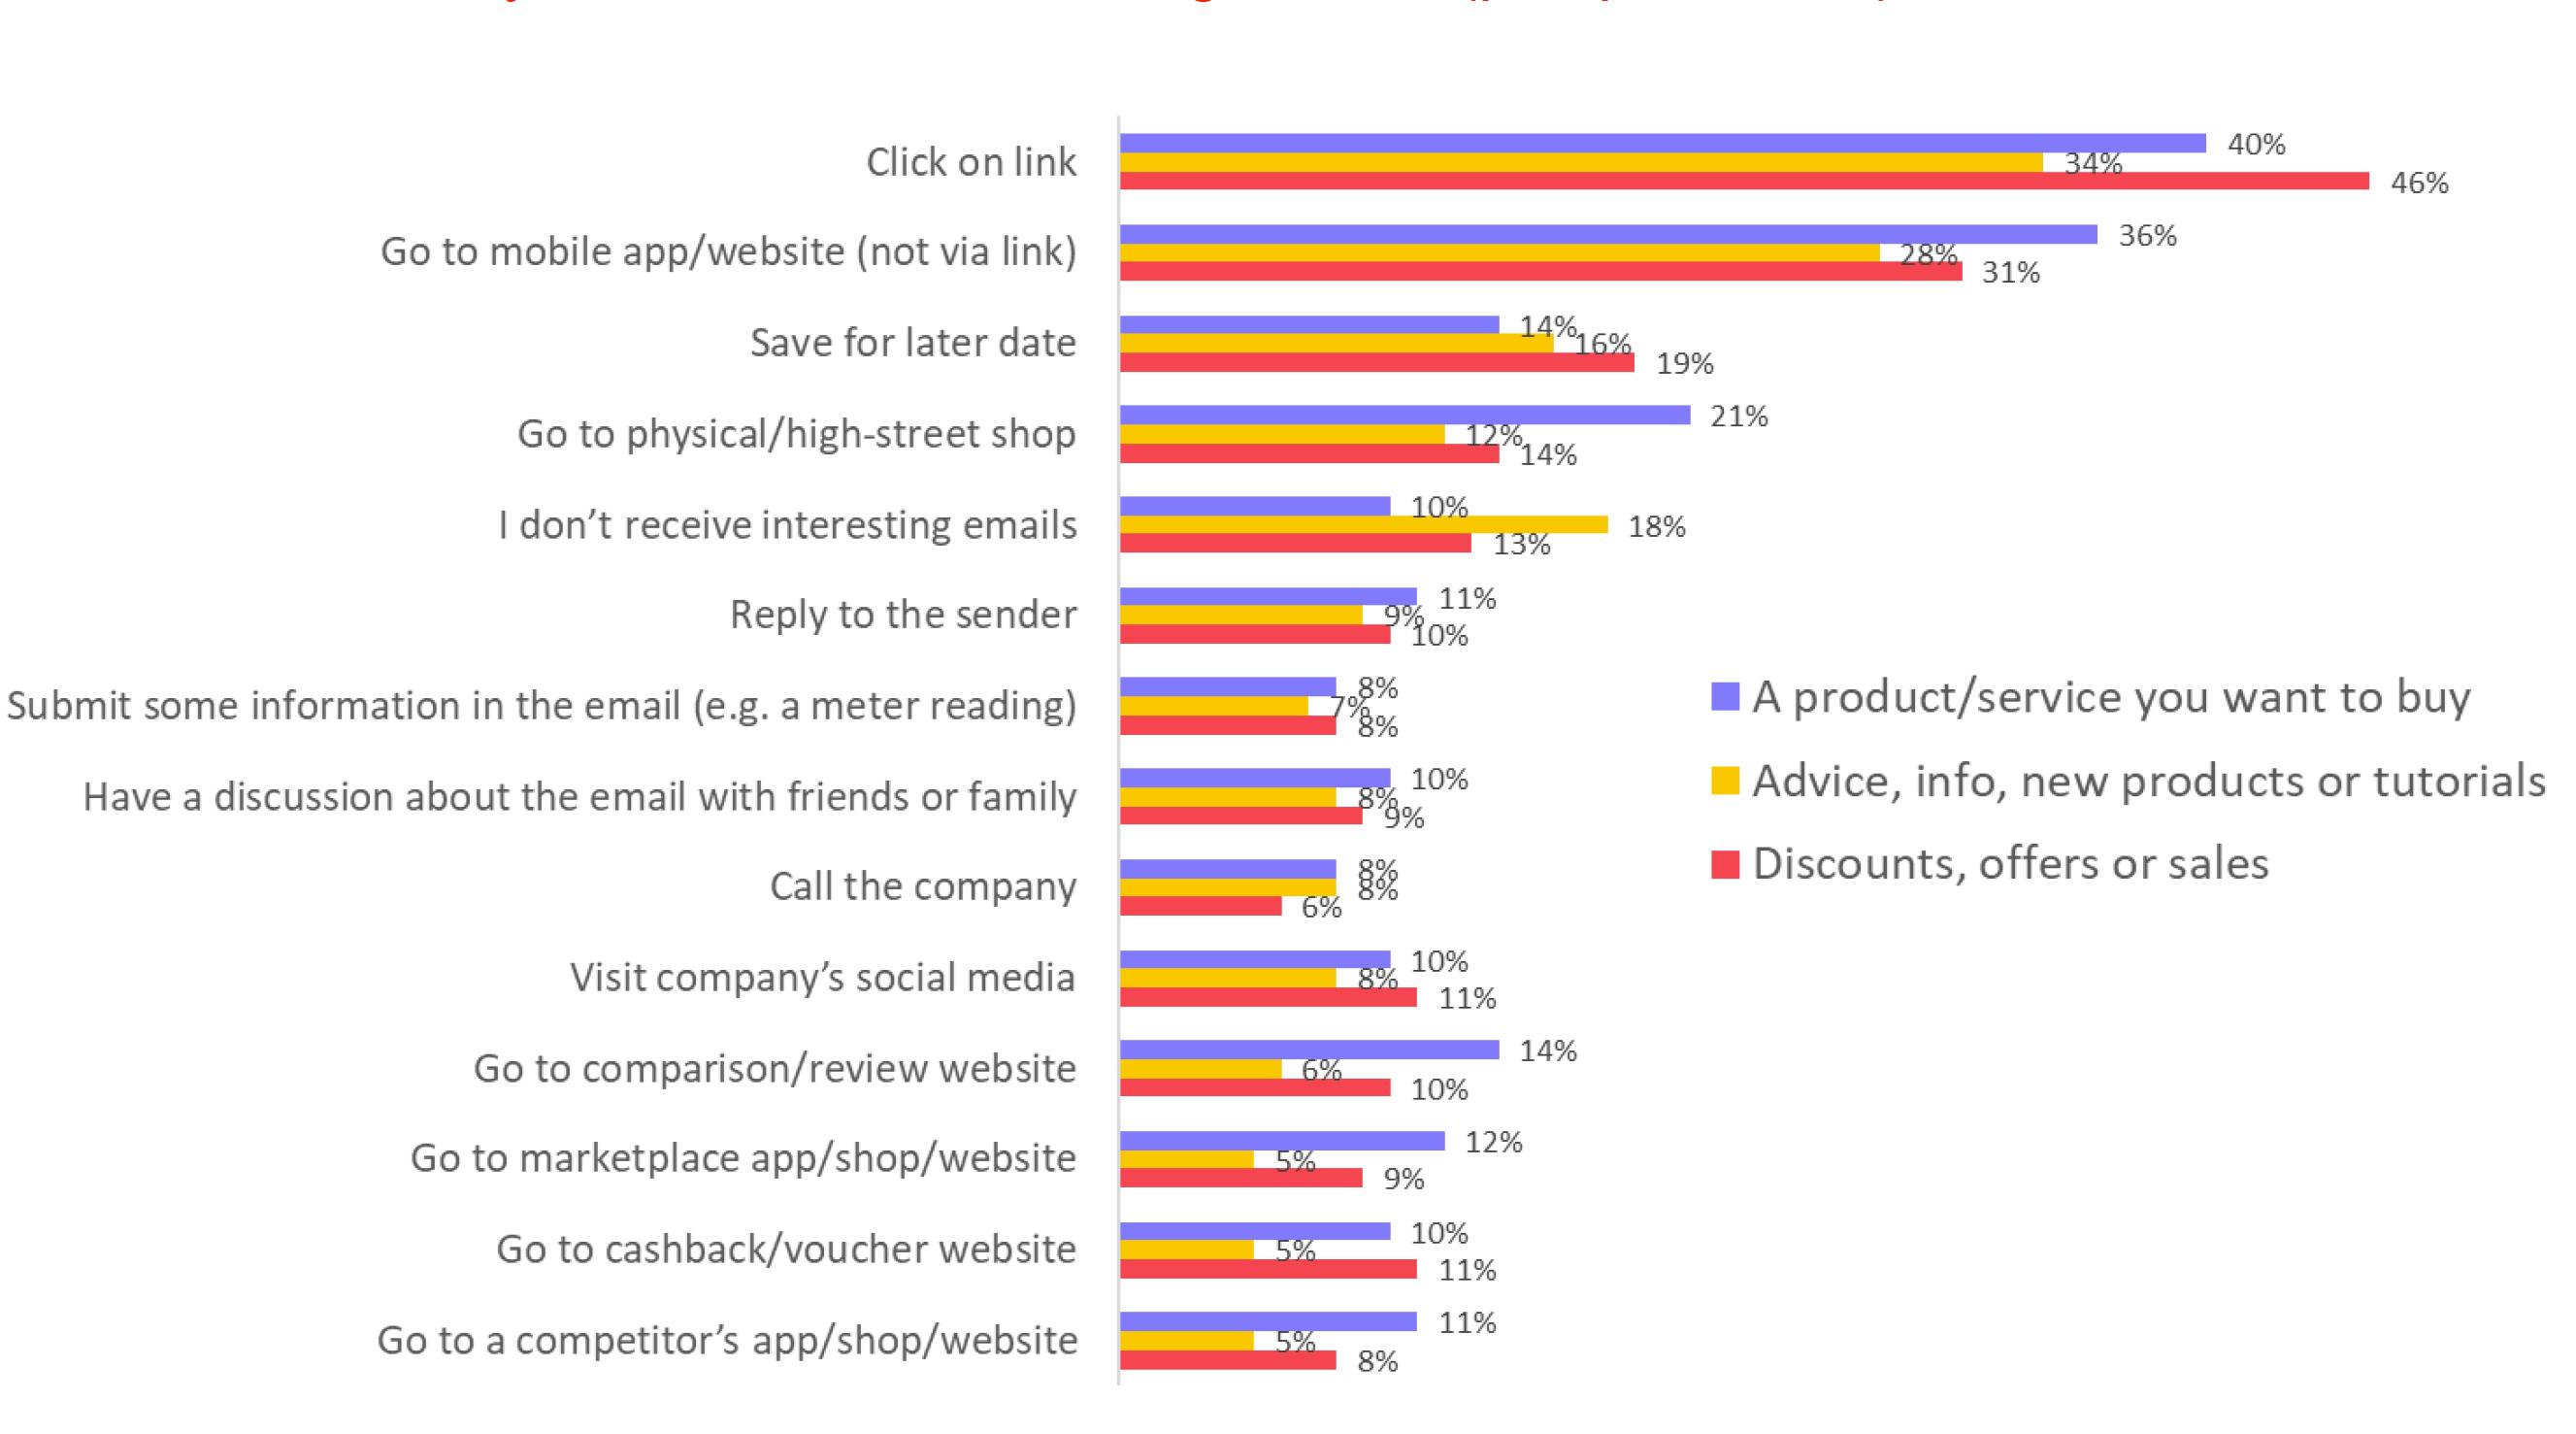
Source: DMA Consumer Email Tracker 2023
The role of email might not be to facilitate an immediate transaction; it might be to facilitate engagement throughout the customer lifecycle, and so different design, copy and behavioural triggers should be used at different points in the lifecycle to maintain engagement.
The topic of finding attribution models that properly quantify each channel’s contribution to a conversion is beyond the scope of this guide. (For more information on attribution models, See Econsultancy’s Measuring Digital Marketing Effectiveness Best Practice Guide.) However, it is appropriate to advise marketers to also review situations in which email’s role can be overestimated. For example, it could be the final touchpoint that nudges a customer into taking an action after a lengthy exchange of communication via other channels.
3.8.1 Open reach and click reach: measure customers, not campaigns
Marketers should look beyond open and clickthrough rates as key measures of success. Email, like other marketing tactics, needs to be considered in the context of its role as part of an integrated strategy for marketing communications. See Section 3.1.1 for definitions of open and clickthrough rates.
Open rate and CTR
Taken alone, a campaign CTR or an average campaign CTR cannot say how the customers are interacting as a whole. While open rate can offer insight into a specific campaign’s performance, it cannot serve as a measure of email engagement patterns over time. (However, if each campaign is only ever considered in isolation, then this is not a problem.)
Customers can have relationships with brands that extend beyond a single campaign. For example, engagement can occur long after a campaign is over. An email campaign may deliver new subscribers who ultimately become customers after further campaigns.
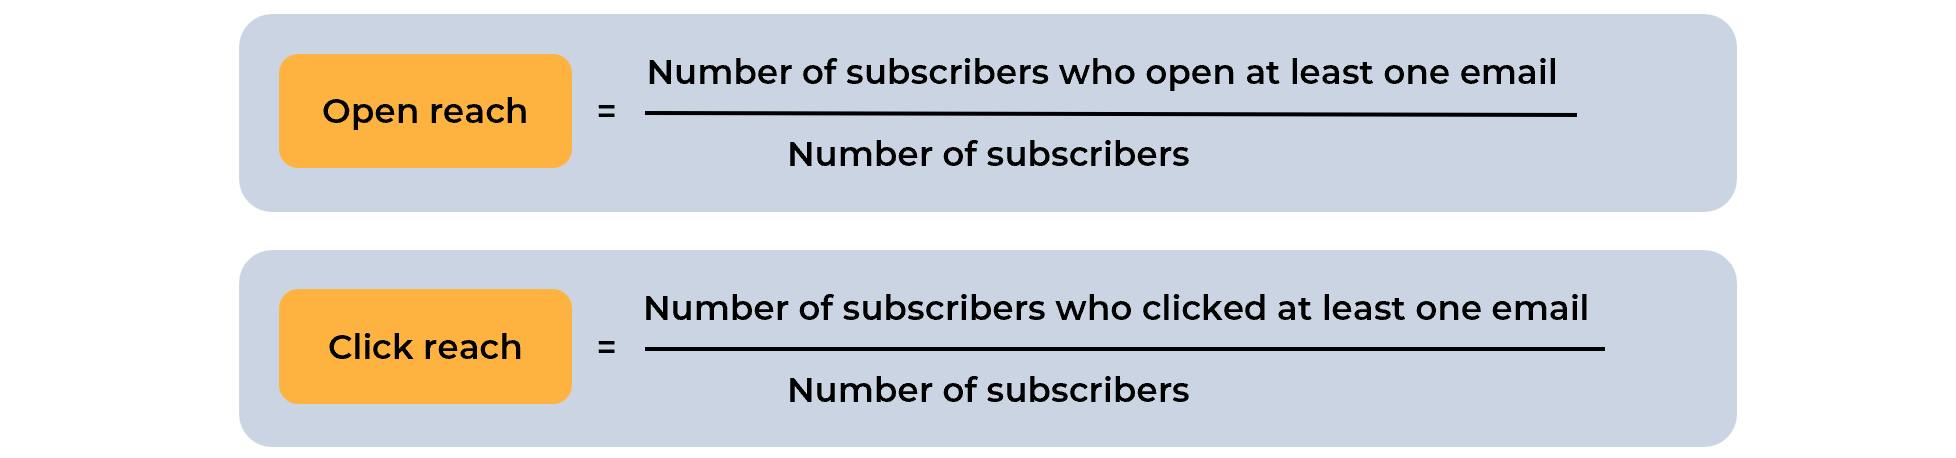
Thus, to avoid under-reporting campaign performance and to capture a more accurate picture of engagement, marketers must measure customer interaction over time and across the entire subscriber base. This is where the metrics ‘open reach’ and ‘click reach’ come into play.
Open rate and clickthrough rate vs open reach and click reach
With open reach, the marketer measures engagement over a period. To put this into context, marketers who send monthly emails would likely need a longer time period to measure the effectiveness of those emails rather than measuring each month in isolation.
Open reach is the percentage of subscribers who opened at least one email during a set period of time, such as a business quarter. If open reach is defined as the total number of unique opens divided by the total number on the list or segment, then click reach is the total number of unique clicks divided by the total number of subscribers in the list or segment.
Figure 4: Calculating open reach and click reach
Both metrics are measured against a set period (e.g. a month, quarter or year) and will vary depending on the nature of the business and its typical buying cycles. For example, FMCG companies may look at this over a quarter while insurance companies may use a time period of a year or 18 months.
Applying the learning: Are you capturing the right metrics?
It is imperative that marketers do all they can to capture meaningful metrics. Simply understanding if they are headed in the wrong or right direction can be a good start. This simple two-step exercise can help show what happens when the wrong metrics are used to declare success or failure.
1. Create three lists
- The 10 campaigns with the highest open rate.
- The 10 campaigns with the highest clickthrough rate.
- The 10 campaigns with the highest conversions or other campaign objectives.
Assuming the conversion calculation is not tied to the open rate but based on emails delivered, the campaigns on these three lists should have little overlap. The outcome will demonstrate whether you can use open rates and clickthrough rates as proxies for conversion rate.
2. Compare the campaigns in each of the three categories
This review might reveal differences or similarities between top-converting campaigns and those with the highest opens or clicks. Campaigns with high open or clickthrough rates might not drive the greatest conversions. If a campaign’s objective is conversions rather than opens or clicks, basing a success declaration on opens or clicks could lead to faulty conclusions.
Consider the following factors to help identify tactics for more successful campaigns:
- Shorter vs longer copy (longer subject lines can act as inbox sorters, which might be more appealing to highly motivated customers).
- Specific calls to action vs general or ‘click here’ CTAs.
- Categories of campaigns, e.g. flash sales vs new product announcements vs informational campaigns.
- Broadcast campaigns vs segmented versions.
Studying data with an eye toward goal-oriented results, rather than focusing on data that is simple to collect, can point the way toward more useful insights that can be used to set strategy, optimise campaigns and generate better results.
Holistic Email Marketing’[10]
4. Reporting
Reports are summations of email performance issued at different time intervals. These can include post-campaign reports, weekly, quarterly or annual reports, or reports created to support budget requests or evaluate the effectiveness of an overall email marketing programme.
Custom reports provide a 360-degree view
“We have tailor-made reports that are sent to us automatically on a monthly basis from our email marketing platform. This has been saving us a lot of manual work. All this data is used and analysed by other departments who provide a 360-degree vision of the marketing campaigns and how they have had a positive impact on the business.”
Mar Juárez, CRM Manager, IVI RMA
Note that email service providers may define metrics in subtly different ways. These subtle differences may affect the accuracy and consistency of measurement. As such, it is important to define each unit of performance for accurate and consistent comparison. Companies that do not define units of performance, such as clickthrough or conversion rate, might observe a change in performance if they change email service providers (ESP). This may not be due to an actual performance change but simply a change in how the ESP measures and presents metrics like ‘open rate’ (something that is impossible to detect with 100% accuracy).
Up to this point, this guide has focused on finding the correct metrics for measuring email success. However, metrics need context to give them meaning. Effective reporting comes into play here.
4.1 The benefits of effective reporting
Despite the uncertainties that can complicate data collection and analysis, good reporting can help the marketing team drive success in six key ways:
- Track trends: Reporting, especially when done at several time intervals such as weekly, monthly, yearly and year-on-year, can indicate whether numbers are trending up or down.
. - Generate insights: Email reports will include the team’s insights based on these trends. For example, the diagnosis of problems, suggestions for ways to improve the programme or proposals for new areas to explore.
. - Budget and plan efficiently: Regular reports will help the team and executives better align budget on initiatives that work or highlight areas that need additional funding to close gaps or move the programme forward.
. - Drive testing: The insights gained from regular reporting can also highlight areas to conduct testing. Reporting can guide tests in message content, design, strategy and other high-level areas.
. - Inform leadership: An in-depth, organised report with figures, analysis and insights keeps the company’s leadership aware of email performance and contribution to company goals. This context is important because it ensures valuable information will be more easily revealed, not overlooked in columns of numbers.
. - Show email’s value to everyone: Reporting helps everyone from the email team understand how email contributes to the company’s goals and bottom line. When everyone understands this value, the marketing team can more easily build a business case for sustained or additional funding.
4.2 A new challenge for marketing: getting reporting right
Reporting is a key responsibility for email marketers at every level, but it can be a major challenge for many email teams. Reporting often takes a backseat when the email team has one person on it, or the team manages many other channels besides email.
Relying on the data delivered by an ESP can be a first step in building an effective reporting process, but it often does not deliver the depth or reliability that an accurate report requires. Further, ESPs often vary in how they collect, analyse and categorise data. Also, when a company moves from one ESP to another, that older data might either be lost or might not line up with the data reported out of the new platform.
Having an email system that makes reporting easy should be a factor in choosing an ESP. The ideal setup automates as much of the data compilation as possible. This reduces the drudgery of manually importing data from spreadsheets and creating visuals for presentations.
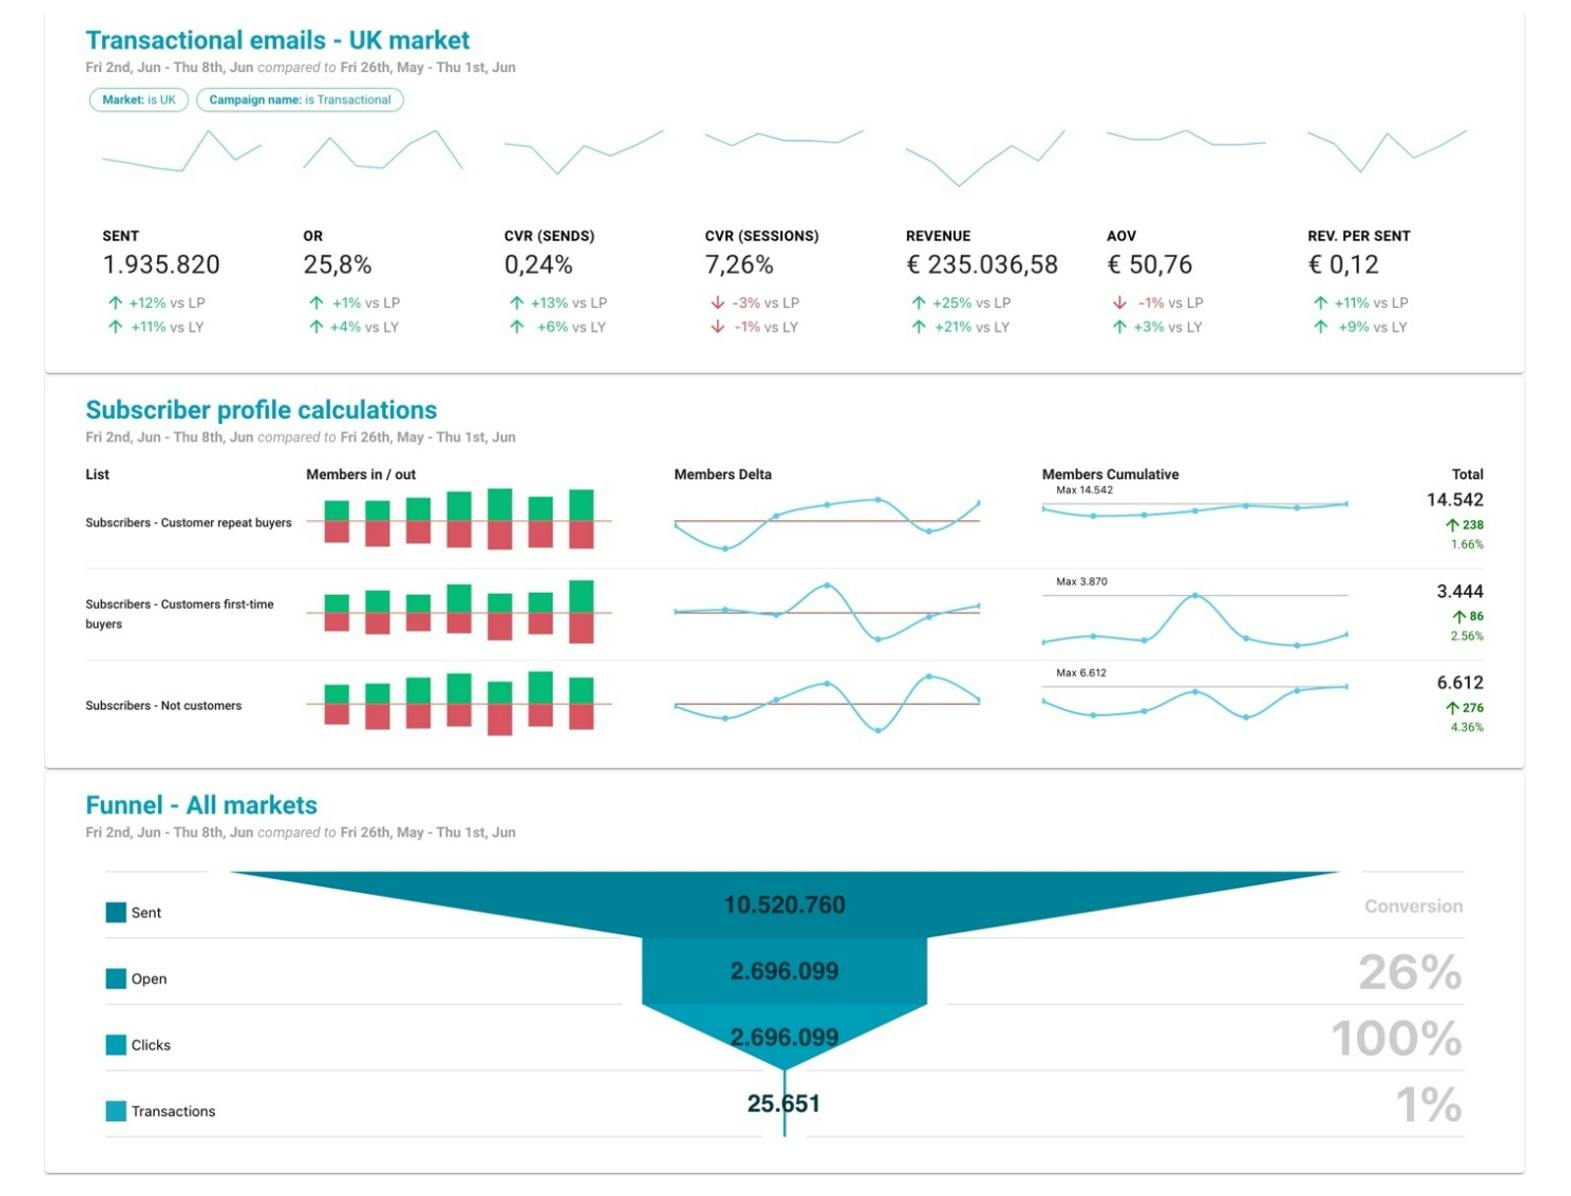
Alternatively, using a third-party tool that plugs into both the ESP and analytics tool, such as Seino.io, can be incredibly helpful – not just for reporting, but also to gain insights. Seino’s easily customisable dashboard is shown in Figure 4.
Figure 4: Seino dashboard
Source: SEINō[11]
Accessible reporting dashboards put data into marketers’ hands
“For reporting, we use Microsoft Power BI. This is online, so the data populates those reports and automatically refreshes. We can look at them at any time and ask: ‘Where are we today? What’s happening with this campaign?’ Our metrics focus on average transactional value, or ATV. We also have opens and clicks for emails along with value per email.
“We work with a customer engagement data analysis team that builds the reports for us, but we can isolate and manipulate the data in them. For example, we might have the whole of our northern European region, which is Denmark, Sweden, Finland, Norway and the Netherlands. We can slice and dice data per country and do some manipulation such as moving the data range.”
Lisa Pettit, CRM Lead Developer, Specsavers
Self-service tools and an analytics team deliver feedback with value
“We have a number of resources we can use for metrics. We use self-service tools that can provide any of our groups with directional feedback on how their campaigns are doing. We also have a fairly large analytics team that can provide more in-depth and targeted research. We want to make sure that we’re returning some value to the business for every dollar spent. It could be a cost-saving value, revenue-generating or improving customer satisfaction. Everything we do is aligned with the broader organisation.”
Kelly Haggard, VP, Marketing Innovation, Synchrony
4.3 Items to include in an email report
A company’s brand, industry vertical, and email goals and strategies will determine what goes into an email report. The following sections should be part of most reports:
1. Essential performance data: This includes campaign-level data involving email activity, as well as objective and business metrics. (See Section 1 for an explanation of each category.)
2. Historical data: This indicates trends, and ideally provides week-on-week, month-on-month and year-on-year comparisons. The data should cover list growth, campaign metrics, all the automated email programmes and other relevant data.
In this section, marketers can analyse the numbers in many different ways when they go beyond the formats provided by the ESP or other marketing platform. The following useful metrics can be calculated:
- List growth: This should include the total emailable list (all the active email addresses in all audiences, excluding unsubscribers, spam complainers, long-term inactive addresses plus new subscribers, new unsubscribers and subscriber churn (net growth or loss) during the measurement period.
- Reach analysis: This reviews the percentage of contacts who acted on at least one email campaign over a set period. It includes both open reach and click reach, but both send and purchase reach can also be used.
3. Insights: These are extrapolations based on the data, such as suggestions for changes to email content, segmentation strategies and acquisition tactics, or suggestions for new programmes or technologies that could help a marketing team achieve its goals more effectively. It is essential to provide context and other enlightening information that can affect performance, such as changes in the audience or email strategy, external events such as holidays and new product launches, or local or worldwide economic factors.
4. Hypotheses to test: Email data influences the testing programme. In this section, marketers can use the data in the platform to discover new things to test, such as frequency, content or segmentation strategy, audiences and more.
5. Questions and concerns: Separate from insights, this space can highlight problems that the numbers reveal, such as declining performance of a specific email programme, an increase in inactivity or challenges in acquisition.
6. Recommendations: In contrast to suggestions based on insights, recommendations are to be actioned. This is the ideal location for putting forward ideas that can improve performance which can be pulled out from Insights, both by using the currently available capabilities as well as by using new technology. It also shows how the use of new technology can help brands achieve specific objectives.
7. Screenshots of recent email campaigns: Here, too, data can reveal the best performing email campaigns. Visuals like these keep decision-makers informed about the progress or results of an email programme. In many cases these can be revelations for higher ranking members of staff who are not as well informed about the value of email programmes.
5. Conclusion
As with any organisation, a marketing team needs a clear set of objectives and strategies to make the most efficient use of its time, budget and human resources. The ability to set achievable objectives rests in large part on what the marketing team knows about the email programme based on past performance.
Being able to measure that performance is one of email’s greatest benefits. Data enables marketers to build a good understanding of who the brand is contacting, what recipients like to receive, what motivates them to click and convert, what happens after they move from the email to the website – all of these factors, and more, can be measured with a rich set of metrics. Having KPIs that use the right metrics to measure progress towards a goal can help marketers know if they are on the right track or whether it is time to chart a new course.
Because objective-setting relies on historical guidance, the need for confidence in KPIs cannot be overstated. Marketers must be certain that the KPIs that measure the progress and the metrics they use for that measurement are being used as intended and that they align with the programme’s objectives and strategies. This will help ensure the team is using its resources wisely and giving the email programme the chance to shine that it deserves.
5.1 Key takeaways
- Email campaigns require clear objectives for measurement and optimisation. Campaign objectives should be aligned with overall marketing objectives.
. - After goals and objectives are set, metrics can be used to understand campaign performance. Standard metrics measure email activity, and include open rate, clickthrough rate and unsubscribe rate. Marketers must also use metrics that align with an email’s objectives, including conversion rate, revenue per email, or total revenue.
. - Track as many metrics as possible, though note that some metrics are more important than others.
. - Create benchmarks to discover trends. Over time, marketers can set up internal benchmark metrics and reporting to track email marketing performance.
. - Reporting is key. A successful email programme needs detailed and relevant email performance reports that let the marketing team understand where it is succeeding or falling short and conveys a more revealing picture of an email programme’s value in helping the company achieve its objectives.
6. Further Reading
6.1 Econsultancy email marketing reports
Econsultancy | Quick Guide to Why Email Still Matters
https://econsultancy.com/reports/quick-guide-why-email-matters/
Econsultancy | Email Marketing Best Practice: Segmentation and Personalisation
https://econsultancy.com/reports/email-marketing-segmentation-personalisation
Econsultancy | Email Marketing Best Practice: Communication Strategy https://econsultancy.com/reports/email-marketing-communication-strategy
Econsultancy | Email Marketing Best Practice: Copywriting
https://econsultancy.com/reports/email-marketing-copywriting
Econsultancy | Email Marketing Best Practice: Layout and Creative
https://econsultancy.com/reports/email-marketing-layout-creative
Econsultancy | Email Marketing Best Practice: Optimisation
https://econsultancy.com/reports/email-marketing-optimisation
Econsultancy | Email Marketing Best Practice: List Quality and Deliverability
https://econsultancy.com/reports/email-marketing-list-quality-deliverability
6.2 Other Econsultancy reports
Econsultancy | Achieving Omnichannel Excellence Best Practice Guide https://econsultancy.com/reports/achieving-omnichannel-excellence
Econsultancy | Customer Journey Mapping Best Practice Guide https://econsultancy.com/reports/customer-journey-mapping-best-practice-guide/
Econsultancy | Customer Lifetime Value Best Practice Guide
https://econsultancy.com/reports/customer-lifetime-value-best-practice-guide/
Econsultancy | Data-driven Marketing Best Practice Guide
https://econsultancy.com/reports/data-driven-marketing-best-practice-guide/
Econsultancy | Ecommerce Best Practice Guide
https://econsultancy.com/reports/ecommerce-best-practice-guide/
Econsultancy | The Fundamentals of Marketing Measurement and Analytics Best Practice Guide
https://econsultancy.com/reports/the-fundamentals-of-marketing-measurement-and-analytics/
Econsultancy | Measuring Digital Marketing Effectiveness Best Practice Guide
https://econsultancy.com/reports/measuring-digital-marketing-effectiveness-best-practice-guide/
6.3 Other reports
DMA | The Importance of Email Preferences
https://dma.org.uk/article/consumer-email-tracker-series-the-importance-of-email-preferences
DMA |The Relevance of Email Marketing
https://dma.org.uk/article/consumer-email-tracker-series-the-relevance-of-email-marketing
DMA |The Omnichannel Communication Race
https://dma.org.uk/article/consumer-email-tracker-series-the-omnichannel-communication-race
Mailjet by Sinch | Inbox Insights 2023
https://www.mailjet.com/resources/research/inbox-insights-2023/
Validity | What the Heck is Mail Privacy Protection? The Impacts of MPP – One Year Later (And What’s Coming Next!)
https://www.validity.com/resource-center/what-the-heck-is-mail-privacy-protection/
Econsultancy | Case Study Library
Econsultancy’s database of case studies showcases best practice and innovation from companies around the globe.

Browse the case study library: https://econsultancy.com/case-studies/
Submit a success story: https://econsultancy.com/case-studies/submit/